Showing posts with label innovation metric. Show all posts

Sunday, December 17, 2023

Learning from innovation dashboards visible through annual reports

Innovation means different things to different sectors and these differences get reflected in how they present their innovation dashboards. For the past few years, several listed companies in India have started presenting their innovation dashboards either explicitly in the form of a table sometimes titled “intellectual capital” or implicitly through various parameters like new product launches, pilots, kaizens, new initiatives, automations, etc. How do these innovation dashboards look? Let’s look at 4 such dashboards as visible to us through their FY23 annual reports. These companies are Tata Motors, Asian Paints, SBI Life Insurance, and Zomato, and their sectors are automotive, building materials (paints, coatings, and home décor products), insurance, and online food ordering. Please note that the innovation dashboard that gets presented in annual reports is likely to be a subset of what is tracked internally. Disclaimer: Some of these companies are my clients, but here I am restricting myself to data available only through annual reports.


What can we learn and not learn from these dashboards?

  • Despite being from different sectors, all four companies had something to report on new products/programs launched in the financial year.
  • Intellectual property especially patents and designs are relevant to Tata Motors and Asian Paints but not to SBI Life and Zomato. Tata Motors in India may be learning the nuances of the game from JLR.
  • Digital transformation is an important focus area for SBI Life while for digitally native companies like Zomato, it is part of the DNA.
  • Automation is an important focus area for all four companies. For SBI Life, underwriting process automation provides a good opportunity for improvement.
  • Partners – insurance agents for SBI Life and delivery partners for Zomato play an important role in their business. Improving partner experience is happening through digital transformation for SBI Life while for digitally native Zomato providing offline experience through resting places with drinking water, washrooms, charging stations, WiFi, helpdesk, and first-aid is important.
  • R&D expenditure as a proxy for experimentation capacity is visible through Tata Motors and Asian Paints reports but not from SBI Life and Zomato. Tata Motors report mentions they have 11 technology hubs/R&D/engineering centres while the Asian Paints report mentions the strength of the R&D team. Zomato report mentions various pilots like Intercity Legends, Zomato everyday, and reusable packaging. These are experiments which may or may not become successful.
  • Continuous improvement must be important to all players. However, systematic efforts are visible through kaizen reporting in Tata Motors and Asian Paints but not in SBI Life and Zomato.
  • Automation through bots is visible in the SBI Life report. However, the efficiency of bot usage can come at the cost of customer experience. Currently, the quality of automated responses to customer support queries is poor in most cases. This trade-off is not visible.
  • Platform is an enabler of innovation and all four players leverage different types of platforms. Tata Motors has vehicular platforms, Asian Paints has chemical technology-related platforms, SBI Life has digital servicing platforms, and Zomato has an order management platform. However, platform-related metrics are not visible in these reports. We can infer that platforms would have played a role when Tata Motors launched 150 variants in a year.
  • Open innovation is an enabler of innovation. Asian Paints report mentions having a technology council with four external members with diverse expertise in various technology areas relevant to the business. Tata Motors must collaborate with other Tata and non-Tata companies, especially in the electric mobility space in creating the ecosystem. However, the related metric is not visible.

In short, there is a lot that can be gathered about innovation from the dashboards available in the annual reports. Innovation dashboard reporting is not a statutory requirement. And yet, it is a good source of input for students of innovation.

Wednesday, February 9, 2022

Innovation dashboard: examples of process goals

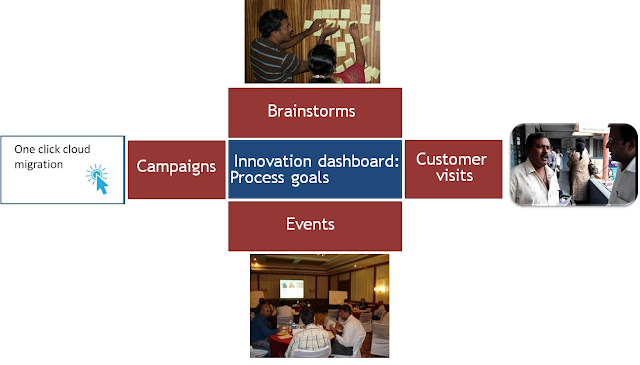
In an earlier blog, I have proposed that an innovation dashboard is the defining characteristic of a basic form (level-2) of innovation maturity. Most innovation dashboards have a bias for outcome goals – ideas, patents, experiments, participation, savings, revenue, profit, etc. However, those who exercise would know the importance of process goals. For an outcome goal such as weight reduction, it helps to have a process goal such as 10,000 steps a day. What could be the process goals in an innovation dashboard? Here are a few suggestions bucketed under four categories: brainstorms, customer visits, events, and campaigns.

1.     Brainstorms: These are meetings where divergent thinking is encouraged. Types of meetings could be:

a.     Challenge book brainstorm: where challenges relevant to a business, function or customer engagement are brought out / prioritized. The team may decide to take a position on one or two key challenges.

b.     Solution brainstorms: Ideas in response to a challenge are explored together

c.      Journey mapping: Observations from the journey of a product/ service/ issue/ ticket are mapped onto a journey board from which patterns/insights could be derived. 

2.     Customer visits: These could be meetings at customer premises or in the field but these also could be focus group discussions where customers are brought together on vendor’s premises.

a.     Field-visit: The objective here could be to interview customers / potential customers. The intent could also be to validate prototypes.

b.     Focus-group discussion: A toy-maker may bring kids while a medical device maker may bring doctors for a focussed group discussion.

c.      Co-innovation workshops: These are workshops where various stakeholders associated with a challenge area are brought under one roof. For example, for a challenge related to education, one may bring students from different schools, teachers, parents or even dropouts if relevant to understand various perspectives. 

3.     Events: could last half day to 2-3 days. Here are a few possibilities:

a.     Innovation review: This could be a half-day event where all innovation projects get reviewed and resource allocation happens.

b.     Hackathon: This 1 or 2-day event might bring people with ideas related to a challenge area under one roof where they build prototypes and bring their ideas alive.

c.      Training: These programs could be a few days to a few weeks long. As part of these training programs, participants may work on business-relevant challenges, create solutions, build prototypes and even present business cases to a panel.  

d.     Innovation day: This day-long event typically showcases innovations from teams within the organization, gets external speakers, and gets people to talk to each other. 

4.     Campaigns: This is arguably the trickiest category. It involves running a campaign around a challenge perhaps over a month or two. It combines some of the elements mentioned earlier. It begins by identifying a sponsor – a CXO or a business head – who is willing to sponsor promising ideas solving business-relevant problems. Some of the steps involved in a challenge campaign area: finding a sponsor, throwing open a challenge, inviting and selecting ideas, organizing a hackathon for selected ideas, mentoring promising teams to develop the ideas further and making a business case and finally presentations to a panel which selects one or more ideas to carry forward.

Hope these examples help in identifying a few process goals for your innovation dashboard.

Wednesday, December 22, 2021

A response from Mark Jarvis on "Defining characteristics of five levels of innovation maturity"

Mark W. Jarvis is an innovation guru at UNO MINDA Group and Head of International Business Development at INITIA Design Studio. We met at an innovation management session at IIM Bangalore a few years ago. He has been extremely kind to give constructive inputs on my blog "Defining characteristics of five levels of innovation maturity". He has separated the characteristics into two categories - one for innovation managers and practitioners inside the organization and the other for stakeholders and innovation benchmarking outside the organization. Moreover, he has expressed his concerns on some of the metric parameters like the number of patents that bother him and suggested better parameters. Thanks a lot, Mark. Appreciate your input.

----------------------
Hello Vinay,

I very much like your “Defining Characteristics of Five Levels of Innovation Maturity”.

I think it is important for any defining characteristic to be “easily” obtained … and distinguished by availability to the “inside the corporation” innovator or to the “outside the corporation” stakeholder.

Since I am always thinking of how to turn things into charts for PowerPoint slides … here is a chart summarizing your thoughts … with some added 
from me.

Inside Corporation  

(for Innovation Managers and Participants)  

Outside Corporation  

(for Stakeholders and Innovation Benchmarking)  

Level 1  


Ad-hoc   


No Tracking  

Likely an authoritarian workplace riddled with confusion, panic, fear, or lethargy. 😉

No Published Evidence Of Managed Innovation   

(or Evidence Of Sustained Poor Market Performance)  

Level 2  


Foundation  


Innovation Dashboard In Use  


Pipeline, Velocity, and Impact (Process and Outcome) Indicators  

Company-specific Innovation Metrics are gathered and reviewed by management and shared with innovation community.    

Annual Report (R&D spend, Number of R&D centers, Number of patents, Number of new SKUs, Number of new product launches, etc.)  

Level 3  


Engaged  


Rigor and Rhythm of Innovation Review  

Rigorous Innovation reviews (feasibility, desirability, scalability, viability, etc) with consequences (for example, projects de-funded or extra-funded) that are well-communicated.   

Observe who attends, clarity of strategic challenges, innovation champion support, and resource re-allocations.  

?  

Level 4  


Aligned  


Innovation Sandbox   

Innovation Sandbox(es) that is focused by a strategic challenge area, has experimentation capacity, dedicated (politically protected) resources and patient management.  

Press Release or other communications about Innovation Sandbox.    

(Note – it is difficult to gauge the quality of the Sandbox effort from outside the corporation)  

Another type of “Innovation Sandbox’ is a well-managed Outside Innovation effort.  

Level 5  


Excellence  


30%+ Revenue from Innovations in the Last Five Years  

Internal Innovation Dashboard metrics will explicitly include tracking of Revenue from Innovation in the Last Five Years and related long-view systemic innovation metrics.  

Annual Report Revenue Contribution (or Growth Contribution)  


Additional thoughts …

About counting the number of patents … this metric bothers me a bit … as I have seen it misused or misunderstood … but I agree it is a good place to start. As a quantity metric it is easy to measure and communicate. Much better would be a patent strategic quality measure … that tracks the business impact of a patent … or tracks the size of patent space covered … or tracks the quantity/quality of patents that reference your patent. But these quality metrics are not easy to come by … or are easily manipulated. I am optimistic that future innovators will have access to affordable software/analyzers to guide and assess a company’s intellectual property portfolio (including patent mapping (Clarivate’s Innography, etc) and patent valuation (Anaqua’s AQX, etc)). Note – one exception to my thinking on this metric comes to mind … perhaps the USA pharmaceutical industry … which seems to extract huge margins through the sheer quantity (sometimes hundreds) of slightly differentiated patents for a key pharmaceutical product.

About Innovation Sandboxes … It is extremely important that sandboxes be politically protected by patient and enlightened management. Typically, there are corporate jealousy, lack-of-cooperation, and unreasonable payoff time behaviors that distract and destroy Sandboxes. For “outside the corporation” folks … I added Outside Innovation as a “type of Sandbox” … since a company’s Outside Innovation efforts (by definition) are readily observed (Maruti-Suzuki’s MAIL, etc.).

About Level 3 Defining Characteristic To An Insider … In addition to robust Innovation Reviews, innovators will notice that leaders will innovate by walking around ("What new thing did you explore this week?") and have pleasant discussions about smart failure.

About Level 3 Defining Characteristic To An Outsider … I am wondering what this could be … to a company stakeholder (investor, financial journalist, innovation benchmarker, etc.)?

I am happy to know your (and others) additional thoughts.

Mark Jarvis

Thursday, December 16, 2021

Defining characteristics of 5 levels of innovation maturity

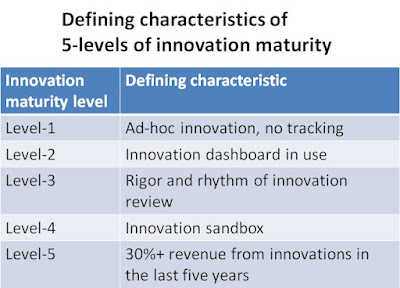
Eight years ago, we proposed a 5-level innovation maturity framework that can be used as a mirror to quickly assess the innovativeness of an organization and help the managers in deciding a future course of action. Earlier this year, I wrote about the level-4 challenge and how organizations struggle to go from level-3 to level-4. In this article, I would like to take a step back and propose a defining characteristic for each of the five levels so that the assessor can generate an initial hypothesis about where the organization stands very quickly – say in five to ten minutes. This is an initial proposal and inputs are welcome.

[Level-2] Defining characteristic: Innovation dashboard: Every organization that is serious about innovation, tracks it in some form or the other. Of course, outsiders may not know it because innovation dashboards are not published, unlike the accounting statements. Then how do we know this? Well, over the last decade many organizations have begun to publish a part of their innovation dashboard in the annual report. For example, many listed companies in India like Voltas, Amara Raja Batteries (ARBL), Titan, Mindtree, and TCS disclose various parameters of their innovation dashboard under the section titled “Intellectual capital”. A manufacturing company like Voltas reports (AR2020-21) R&D centers, R&D strength, no of new SKUs, and no of 5-star energy efficiency SKUs. Mindtree reports (AR 20-21) parameters like innovation hubs, centers of excellence, No of patents, etc. And even for organizations like TVS Motors (AR 20-21) which doesn’t present “intellectual capital” in a separate section, one can find parameters like “New product launches”, R&D expenditure, and expenditure on technology imported in the last 3 years etc.

I feel a good innovation dashboard should have indicators for pipeline (small, medium, big bets), velocity (e.g. experiments, champions, hackathons, reviews, dedicated teams), and business impact. It should be a combination of process (e.g. hackathons, reviews) and outcome (no of ideas, prototypes, revenue, saving) parameters.

The main point is a simple innovation dashboard is a defining characteristic of level-2 innovation maturity.

[Level-3] Defining characteristic: Rigor and rhythm of innovation review: You could use an innovation dashboard like a status reporting tool for years. And that might not be very effective. The question is what kind of decisions and resource allocations are you doing after reviewing your dashboard and innovation projects?

Over the past decade, I have had the opportunity to sit through a number of innovation reviews. Moreover, I have had discussions with many executives on how they conduct an innovation review. Good innovation reviews are rigorous despite the uncertainty surrounding various aspects like feasibility, desirability, scalability and viability. It questions the speed and quality of hypothesis testing. As Ken Kocienda, the father of auto-correct feature in iPhone points out in the book “Creative selection”, Steve Jobs used to review prototypes of major features himself. And Ken gives a detailed account of how such a review happened in the book. Jeff Bezos’ big bet review seems to be rigorous and yet mostly doesn’t involve return-on-investment language and cash flow projections.

If I were to pick only one thing to observe in the organization to gauge its innovation maturity, I would choose an innovation review. It reveals management seriousness based on who attends, the clarity (or lack thereof) on strategic challenges, showcases key innovation projects along with their champions and experiments, and kinds of questions asked, and reveals the commitment through resource (re-) allocation.

[Level-4] Defining characteristic: innovation sandbox: In our book “8 steps to innovation”, we identify three big bet enablers: innovation sandbox, platforms and open innovation. However, if I were to pick one big bet enabler, I would pick innovation sandbox.

Innovation sandbox: Unlike a lab that can start with a technology focus, a sandbox needs 3 to 4 constraints within which the experimentation capacity is to be built. For example, having an Artificial Intelligence lab is not enough. It needs to be combined with a strategic challenge area relevant for the company such as healthcare diagnostics for a broad customer category such as hospitals or end-consumers but typically not both.  An innovation sandbox combines strategic focus, experimentation capacity, and dedicated resources, all are crucial for big bet incubation. Amazon Go sandbox was built around image recognition and cashier-less offline retail idea while Alexa sandbox was built around speech recognition, display-less, cloud-connected personal assistant idea.

Many companies such as automobile, aircraft, and phone manufacturers and many technology companies have product platforms. These are used mostly to churn out newer product variants at a faster pace. They are valuable for variant generation at a faster pace. However, I wouldn’t consider them big bet enablers. Creation of a new platform would need a sandbox focus. Facebook has been a super successful platform. However, most of their subsequent big bets like WhatsApp and Instagram have been acquisitions. I am sure their most recent big bet Metaverse would have needed a lot of strategic focus and experimentation.

Sandbox hesitancy hypothesis says that management tends to be hesitant in building a sandbox due to their inability to identify those 3 to 4 constraints and commit resources to build experimentation capacity.  

[Level-5] Defining characteristic: 30% revenue from innovation in last 5 years: Philips annual report in 2020 mentions that “Around 60% of revenues from new products and solutions introduced in the last three years” under the “intellectual capital” section.  Instead of revenue, a company may look at growth contribution from innovation. For example, 3M mentions in its 2020 annual report that “For the full year, our priority growth platforms grew 7%, outperforming the markets they serve.” These priority growth platforms include indoor air quality, biopharma filtration, and automotive electrification from a list of close to 50 platforms that it has developed.

To summarize, innovation dashboard (level-2), rigor and rhythm or innovation reviews (level-3), innovation sandbox (level-4), and 30% revenue from innovation in the last 5 years (level-5) are defining characteristics for the 5 levels of innovation maturity respectively.

Saturday, August 24, 2013

2 dimensions of innovation maturity: creative confidence and incubation effectiveness

A couple of month’s back I presented a 5-level assessment framework based on our book 8-steps to innovation. It depicts characteristics of an organization as it goes from level-1 (Jugaad) to level-5 (Excellence). One question that I got asked on this was, “What are we trying to improve in the first 2-3 levels? And then in the next 2-3 levels?” This article is a response to this question. It presents a two dimensional view of innovation maturity – the first dimension being “creative confidence” and the second dimension being the “incubation effectiveness”. I believe it provides a simplified and yet useful view of innovation maturity. Let’s first understand the two parameters and then the sequence of focus.

Creative confidence: Creative confidence represents the capacity of the organization to identify and frame problems and create responses (ideas) to the problems. One popular proxy parameter for creative confidence is “idea per person per year” and another one is “participation” typically measured as a percentage of employees giving at least one idea in a year. An ultimate test of the creative confidence is, “Does janitor submit ideas to improve things?” Of course, creative confidence for a senior manager or a Product Architect would involve different type of problems and solutions than that of a fresher.

Incubation effectiveness: This parameter measures the effectiveness with which not-so-small ideas get incubated and selectively implemented to create business impact. Organizations create a separate lab to incubate typically large impact ideas. Sometimes an incubation team sits within a business unit and another team sits outside the business unit – under corporate umbrella. A lead indicator for incubation effectiveness is the total value of ideas under incubation and a lag indicator is “percentage of revenue coming from ideas incubated in last 3-5 years”.

Kaizen vs Lab corner: If you are in the kaizen corner, it means you are generating & implementing lots of small ideas. However, you are doing a poor job of incubating big ideas. If you are in the Lab corner it means you are doing a good job of incubating big ideas but doing a poor job of improving existing products / services. In the Daily-rut corner you are doing neither. Ideally you want to be in the Excellence corner.

An innovation journey could begin in any of the two directions. However, I feel that helps to build a critical mass of people (say 30%) confident of innovating. This increases the chance of sustaining the initiative. We have looked at how organizations like Cognizant build creative confidence. In the next few articles I want to explore what it means to run incubation centres effectively.

Wednesday, May 15, 2013

5 levels of innovation maturity


One feedback I and my co-author Rishikesha Krishnan have been getting in our talks/discussions is – Is there a way to assess where we stand on innovativeness based on the framework in 8-steps to innovation? That triggered us to create an assessment framework. In this article we present a broad outline of the framework and illustrate how organizations move from one level to the next in their innovation journey. We will use publicly available data from two organizations: Toyota and Cognizant. We really appreciate the detailed accounts created and made publicly available by Yuzo Yasuda for Toyota and Kumar Sachidanandam for Cognizant. We hope more organizations follow the practice in future.

From Ad-hoc to Foundation level: Level-1 called Ad-Hoc is no brainer – if you don’t track ideas in any form, then you are at level-1. To begin your journey from Ad-Hoc to Foundation level (level-2), you need to implement 3 core processes: idea management, buzz creation and training & development. However, to qualify you at the foundation level, you must get at least 10% of the employees to contribute at least one idea annually. This journey can take a few days to a few years depending upon the size of the organization. For example, it took Toyota 5 years and Cognizant  3 years to clear the 10% participation hurdle.

In the early phase, most organizations emphasize idea management process and also organize trainings. However, the process which needs special attention is the buzz creation process. Apart from rewards and recognition, it involves things like organizing events, running campaigns, publishing newsletters, success stories and dashboards, building communities of practice etc. In Toyota it involved organizing exhibition of implemented ideas, field trips and changing the tone of the communication from a formal to informal. In Cognizant, it involved creating a set of champions who facilitated igniter sessions, identified problems, mentored idea authors etc. Moreover, it involved organizing innovation fairs in India (4 in the 3rd year) and outside India (11 in the 3rd year), publishing innovation journal from second year and organizing innovation summit from the third year.

From Foundation to Engaged level: Level-3 is called “Engaged”. Getting 10% of the people engaged innovation activity is one thing. However, sustaining the engagement at 30% is something else. What are the people engaged in? People are engaged in various activities related to innovation, but at this point the two activities which matter most are experimentation and reviews. The metric also says at least 10% of the ideas should have prototypes created for them. Unfortunately, this data is not available from these organizations. However, we believe that creating a culture of experimentation is perhaps the most difficult aspect in this journey. For management, getting a habit of reviewing ideas / proposals and doing it effectively also takes time. For a services company like Cognizant, it may involve facilitation in getting a buy-in from customers. This is also a crucial phase when the treatment given to those whose ideas / experiments have failed sends a strong signal to everyone. If the organization can’t show tolerance for failure during innovation, it is difficult clear this level. For Cognizant, the 30% hurdle was cleared in 3 years since the program started. Note that another requirement to clear this level is to have business impact calculator in place. For Cognizant it was put in place in the third year.

For Toyota, it took 15 years cumulatively to clear level-3 and 10 years after clearing level-2. Getting middle management engaged is usually a challenge. Toyota mandated that for the second round of review of selected ideas, it is not the idea author (typically a shop floor worker) but his manager present the case. A self-organized community of gold-silver-bronze medalists called “Good Idea Club” made a difference.  

From Engaged to Aligned: Up to level-3 (Engaged) the innovation program can run within a division or function. However, at some point it needs to enable differentiation for the organization i.e. it should align with the strategy of the organization and perhaps help create one. This usually means two things: One, there should be one or more innovation sandboxes with dedicated teams created within a few strategic constraints and experimentation should go from low-cost high-speed to low-cost high-speed and high-volume within the sandbox. Two, there should be a healthy big idea pipeline e.g. Total potential impact of the big idea pipeline > 10% of revenue. For most organizations it also means having a few specialists who can think deep within their domains of expertise.

At Cognizant, creating a concept lab was a step in the direction. Specific focus areas were identified e.g. Text mining, Faceted browsing and Robotics and slowly expanded to include semantic web, big data analytics, autonomous computing, augmented reality etc.

Note that idea per person per year metric is expected to be at least 1 to clear this level. It took Toyota 19 years cumulatively to clear this and Cognizant may have cleared it the current financial year.

From Aligned to High Batting Average: This is the final and output centric level. Rate of success for implemented ideas especially for large impact ideas should be greater than 50%. We have borrowed this metric from what A G Lafley ex-CEO of P&G set for their innovation program. Similarly, it helps to see how much of current business comes from the innovations in the past 5 years. We have currently put 20% - similar to product vitality index of 3M which is currently at 33% and that of Eureka Forbes which is also at much higher than 20%.

This is our current view and it is evolving as we talk to more organizations. I keep updating this post with the latest version of the assessment chart. If you have any inputs and/or need any help in assessment, please contact us at: vinay@catalign.com

Source:
Kumar Sachidanandam et. al, “Is managed innovation an oxymoron?” Jan 7, 2013.

Saturday, May 19, 2012

Baseline rates in innovation management

Wikipedia says that Fetal Heart Rate (FHR) should be between 110 beats per minute (bpm) 160 bpm. Anything beyond this range is considered abnormal. These rates are called baseline rates. FHR baseline rate is the same no matter which culture or nation the baby is born into. Are there any baseline rates in innovation management similar to FHR baseline rates? I don’t know. However, I feel that we need to establish them as they are going to be very useful in making various decisions in managing innovation. Nobel Laureate Daniel Kahneman highlights in “Thinking, fast and slow” that baseline rates are a good starting point while making risky decisions. In this article, I present my current view and a first attempt at the baseline rates relevant for innovation management.

Let me qualify the data set first. These rates are based on the data from 25 to 50 organizations depending upon the parameter. There are some parameters like the “idea per person per year” and “participation” where data is available from more organizations (50). And there are parameters like “response time” and “success rate” for which data is available from fewer organizations (25). Moreover, these numbers are not averages. Like FHR baseline, they are linked to the health of the innovation engine. Currently I have used my judgement in calling some rate “poor, OK or Good”. I have used publicly available information such as INSSAN benchmarks as well as data published from companies like Toyota and P&G. Moreover, I have also used data from a dozen odd organizations where I have seen the innovation engine personally.

Let’s look at each parameter briefly:

Idea pipeline (General): This parameter says that if you are 1000 people organization and if you have an idea box (physical or on intranet), then you should get at least 1000 ideas in a year to qualify for “good” category. If you get, say 150 ideas, then you are OK. And if you get 70 ideas in a year then you are poor. The maximum number I have seen is from Brasilica (a Brazilian firm) is at 143.

Big idea pipeline: Many organizations manage a separate pipeline for large impact ideas. Take each idea in the pipeline and identify how much business impact (annual) it projects today. Let’s say your big idea pipeline has 3 ideas with following potential revenue: 1 crore, 3 crore, 1 crore and if your revenue is 100 crore then total business impact of the pipeline is: 1+3+1 = 5 and the ratio of total business impact to revenue is 5/100 = 0.05. The table says it is “poor”. GE’s breakthrough imagination has 100 ideas each with a minimum potential of $1 billion. That makes the ratio at least 0.67 (perhaps the actual ratio is > 1).

Participation: Less than 5% employees giving at least one idea in a year is “poor”. More than 30% doing the same is “good”. See here how this parameter evolved in Toyota over 40 years.

Response time: How soon are you getting in touch with the person who submitted an idea? Less than a week is “good” and more than a month is “poor”. For example, Shell Gamechanger process promises to communicate input on your idea within 48 hours.

Success rate: This is the trickiest parameter. Too high of a success rate may mean nobody is taking any risk. Check out my article “Lower your batting average to improve innovation productivity”.

Will these baseline rates change as we get more data? Yes. Will the role of baseline rates diminish? I doubt it. As I mentioned this is my first attempt and your inputs would be greatly appreciated.

Monday, January 9, 2012

Weighing scale, intelligent gossip and the culture of innovation

Gossip is an important element of every culture, be it in the café, corridor or conference room. In fact, Nobel Laureate Daniel Kahneman writes in the introduction of his new book “Thinking, fast & slow” that the primary objective of the book is to generate intelligent water cooler gossip. Which is the most powerful source of gossip? Perhaps there is no easy answer. However, “weighing scale” is certainly a good candidate. When ten of us, old school friends, met a couple of weeks back after a long time, the starting point of the conversation was invariably – how much weight one has gained or lost. What makes “weighing scale” such a remarkable gossip generator? Can we design “weighing scale” for measuring innovativeness? Let’s explore.

The first thing that strikes about any weighing scale is its simplicity. You don’t need a user manual. Have you seen 6-7 year olds weighing themselves? They don’t need any help. The second interesting property of weighing scale is its ease of access. As a kid I remember how weighing was performed as a ritual at the railway platforms every time we traveled by a local train in Mumbai. Anyone who is interested in weighing can find one – either free or at a low cost. The third property is very special and perhaps not understood by most as unique. Weighing scale is emotion-proof. It gives the same weight no matter how angry or anxious you are. Contrast this with blood pressure machine, voting machine and stock price – all are anxiety dependent.

Combination of the first two properties, simplicity & ease of access, creates what is sometimes called a self-test. It is like saying, “Go check it yourself”. Kahneman observes in “Thinking, fast & slow” that embedding “self-test” in the research papers helped he & his co-author Amos Tversky reach out to a wider audience outside psychology fraternity. Authors Chip & Dan Heath mention in “Made to stick” that self-test is a powerful way to build credibility for your idea. An ECG or an MRI scan are not self-tests. Neither can you do it yourself (yet), nor can you diagnose the results.

Designing a measurement system that has a self-test and is emotion-proof is like creating a “weighing scale”. At the very least, you are generating an intelligent gossip. When I wrote about a simple innovation dashboard for checking how innovative you are a year and a half ago, I was trying to create a “weighing scale”. Contrast this with a perceptual survey which is based on questions like “Do you feel the environment in your company is conducive for innovation?” etc. It is neither self-testable nor emotion-proof. I don’t mean to say that these kinds of surveys are not useful. It is just that they are not “weighing scale” like and hence may not lead to intelligent gossip.

In the spring of 1884, Thomas Edison supervised 2,774 lamp experiments at Menlo Park. In 2010, Google engineers performed 20,000 experiments to improve the search algorithm and took 500 ideas live. Won’t it help to build a richer vocabulary of this kind and in fact, generate intelligent gossip from it? I believe it can be a first step in building a culture of innovation.

Related articles:

Innovation dashboard: 4 indicators of idea velocity

Innovation pipeline: a popular lead indicator metric on innovation

Wednesday, December 7, 2011

Benchmark data from INSSAN Excellence Contest in Suggestion Scheme – 2011


Idea management systems exist in the organizations at different levels – process improvements (kaizen), new product development (NPD), new business development (NBD), Intellectual property management (IPR) etc. Indian National Suggestion Scheme Association (INSSAN) has been benchmarking the suggestion schemes in primarily manufacturing sector for the past 20 years. The latest bulletin (Sept-Oct 2011) presents the benchmarking data from 27 organizations for financial year 2010-11 – Automotive (6), Engineering (6), Fertilizers (7), Associated (6) and Steel (2). Mr. Sudhir Date has presented the highlights in the bulletin (pg 14).

As discussed in an earlier article, I try to view the innovation metric from following three perspectives: (1) idea pipeline (number of ideas & participation of employees) (2) idea velocity (rate at which ideas move forward) (3) batting average (net potential impact in savings / revenue). Let's apply this lens to the INSSAN 2011 data.

Idea pipeline: Ideas per person per year is an excellent proxy for idea pipeline. For the past few years TVS Motor consistently stands out for ideas per person per year metric. On an average, a TVS employee gives a suggestion almost every week (46 in a year) as compared to India average of once in 2 months (6.5). India average has been hovering around 5-6 for the past 5 years. Participation percentage varies from 22% in Fertilizer sector to 90+% in Steel and Auto sectors (see figure below). Steel and Auto sectors were the first in India to embrace suggestion schemes. So this is not surprising. More the participation, more sustainable is your process.

Idea velocity: Unfortunately we don't have a good data on this. Lowest lead time for evaluation of suggestion is definitely an indicator and Maruti’s performance of 2 days is commendable. However, we don't have average data on this and we can guess why.

Batting average: Suggestion schemes measures the impact primarily through savings. Savings per accepted suggestion is a good indicator. India average of Rs.19,681 makes a good case for running the suggestion schemes.

On an average 70% of the suggested ideas are implemented and that looks pretty healthy.

Following table shows the data sector-wise.

Let’s hope we get similar data for other types of idea management systems in India as well.

Related articles:

Idea management systems in India: Benchmark data from INSSAN 2005-2008

INSSAN 20th Annual convention: where shop-floor innovators are heroes

INSSAN convention: sources & types of innovations and a good practice

Thursday, September 1, 2011

Innovation dashboard: 4 indicators of idea velocity

Last year I presented a simple innovation dashboard with 4 parameters: pipeline, prototypes, portfolio and participation. What do these parameters measure?

  • Pipeline: How many ideas do we generate?
  • Prototypes: At what rate do ideas move forward?
  • Portfolio: What is the total potential impact?
  • Participation: Is the innovation activity likely to sustain?

A few months back I wrote about innovation pipeline and how CEOs are using it for strategic decisions. In this article

I want to focus on idea velocity – the rate at which ideas move forward. What are the different indicators of idea velocity? Let’s look at 4 such indicators below.

1. Responsiveness: How fast does the system respond to an idea submitted? In places like Boardroom Inc, a Connecticut publisher, ideas get evaluated in weekly team meeting. Many small ideas can be implemented within the team and don’t need any approval of higher authority. In Toyota, it works in a monthly cycle and uses hierarchical approval system. Small ideas get evaluated and awarded locally. In any process that takes more than a month to respond to the idea author, it is a cause of concern. In a social network with a voting system, the feedback can start very quickly.

2. Prototypes: First prototype could be a paper sketch (used by Tata Nano team), a skit depicting the usage scenario or a computer simulation model. What matters is how fast does the idea go from a concept to a prototype? And then from the first to the second and so on. First AdSense prototype was built in a few hours by Paul Buchheit. Amy Radin, Chief Innovation Officer of Citigroup, looks at: getting x number of pilots in market by y date. Google says, it performed 20,000 experiments in 2010 to improve its search algorithm and finally took 500 ideas live.

3. Champions: How many ideas have a champion? Champions are people with clout. They can push your idea through the resistance faced within the organization or outside. You are lucky when the idea champion is the group chairman (like Ratan Tata). However, more often he is likely to be a senior manager like David Patrick at IBM. Sometimes, your customer could also become your champion. For example, Lego involved selected advanced users in co-designing & championing its Mindstorm NXT.

4. Dedicated team: Any not-so-small idea can run only so far as a side activity. It needs a dedicated team, even though it could be just 3-4 people to begin with. Dedicated team is an indicator of the seriousness and attention from the management. For example, Tesco India has a problem solving track where a cross-functional team attempts to solve a chronic problem of the businesses. Rigor and rhythm of innovation reviews play an important role in making sure that selected ideas get appropriate resources.

I am sure there are more or better indicators you may be using. Your input will really help me get a better view of this metric.

Tuesday, March 15, 2011

Innovation pipeline: a popular lead indicator metric on innovation

It is no use hearing the fire alarm after the fire engulfs you. The real value of any metric system is in raising alerts so that you have time to take action. Innovation pipeline seems to be the most commonly used lead indicator metric by CEOs to track innovation in the company. In fact, GE CEO Jeff Immelt told his top leaders, “If you can do only one thing well, this is what I’d pick: Make sure this pipeline is always full”. What kind of strategic actions are taken by CEOs after reviewing the innovation pipeline? Let’s look at a few examples from 3M, GE, Biocon, HUL and Infosys.

Following story is narrated in 3M’s storybook “A century of innovation”: One Saturday morning in 1940 CEO McKnight analyzed the “birth rate” of 3M products. He ticked them off: Wetordry waterproof sandpaper in 1921, Scotch masking tape in 1925, Scotch transparent tape in 1930, Colorquartz roofing granules in 1933 and rubber cement in 1934. Then there was a six-year dry spell. Although Scotchlite reflective sheeting was created in 1937, the rewards of that new product had not yet been recognized. “While these dates are only approximate and are really predicated on when the product commenced to yield some profit, it indicates rather a long period of hunger . . . nothing appears to have been developed since the rubber cement birthday,” McKnight wrote Carlton. McKnight took an action the same day and 3M’s New Products Department was born. In a memo dated October 12, 1940, McKnight wrote, “3M is spending a substantial and an increasing amount on research every year. It’s time to create a department to cooperate with all interested parties in studying the commercial value of each research project upon which money is being spent.”

One of the initiatives that Jeff Immelt kicked off when he became CEO of GE in 2001 was “Imagination breakthrough”. It is a pipeline of ideas that could generate more than $100M in incremental revenues. Out of the 30 ideas that entered the pipeline in the first year, about 20 of them turned out to be good projects. Today the pipeline is managed by CMO Beth Comstock and has 100 plus ideas in the pipeline with everything from new stroke technologies that are offered to ambulances to solar or wind energy technologies. Immelt tracks about 30 of them every month.

I am sure Indian CEOs review their innovation pipeline as well. Biocon CEO Kiran Mazumdar-Shaw has mentioned in the annual meeting in 2007 that there is an “enviable research pipeline” and she mentions a few programs in the pipeline like oral insulin, an antibody for Rheumatoid Arthritis etc. In a Q&A session at India Knowledge @ Wharton HUL CEO Nitin Paranjpe mentions that “We have a robust innovation pipeline across categories.” Similarly, Sandeep Dadlani, Head, Retail, consumer goods and logistics at Infosys mentioned following in the analyst meet in July last year, “There is a significant innovation pipeline of new ideas, new solutions, new IP at Infosys which is being evaluated literally every month. Business plans are being reviewed and approved.”

If everybody tracks innovation pipeline, what is the differentiator? Is it about how some of those ideas are linked to customer’s anxieties and aspirations at a deeper level? Perhaps coming out of an immersive research like P&G does or a “dreaming session” with customers like Immelt does? Is it about a discipline of funding & protecting investments in the good ideas and parking the rest? Is it about ensuring the speed of experimentation and customer feedback cycle? I don’t know. Any thoughts?